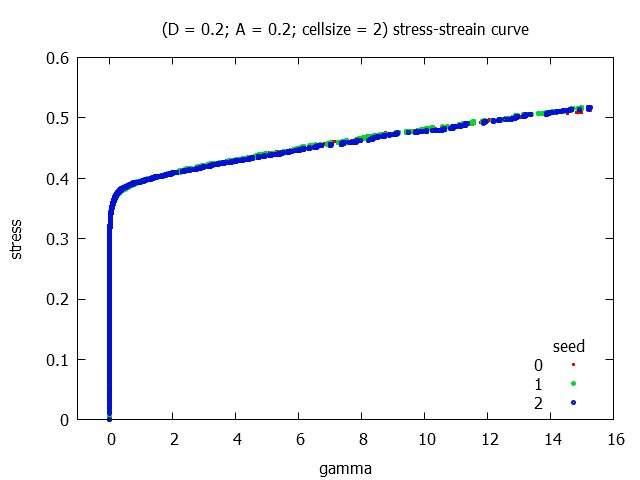
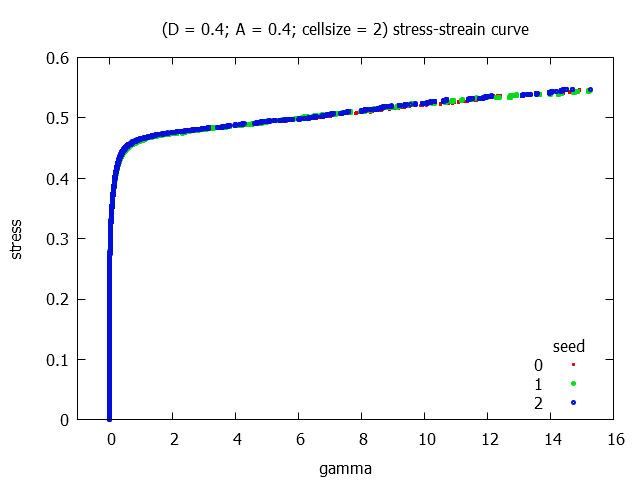
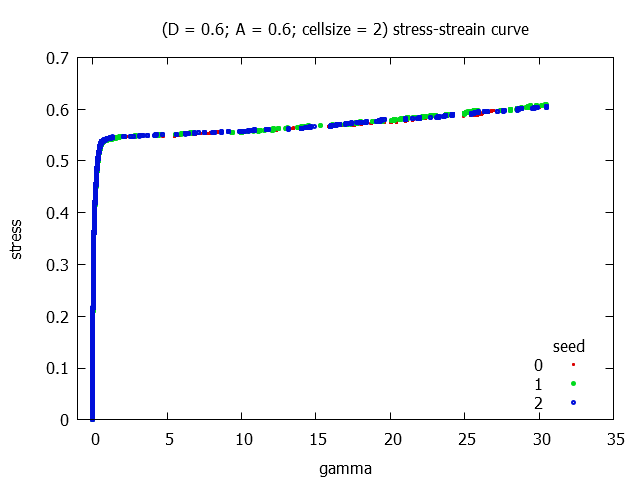
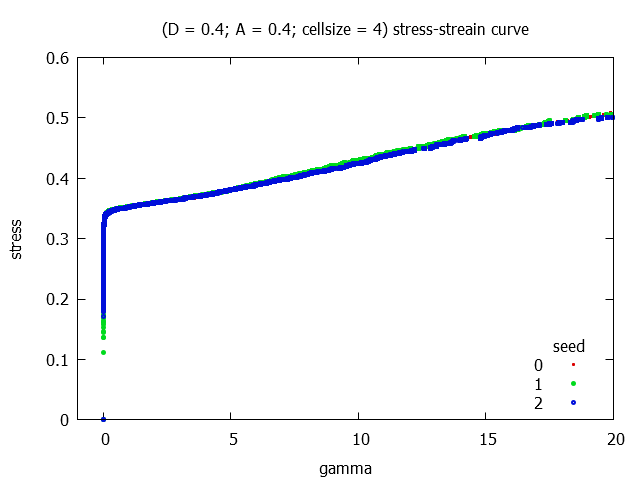
Stress-strain curves (click to open and to collapse)
For 3 different realisations in each parameter-sets the stress-strain curves are plotted.
Last modified:
Hereby some results can be found from the 2D discrete patterning code, as a developement of the old SCPM model.
The simulations shared the following parameters:
Differences were in the following parameters
The following parameter-sets are used:
| D | A | cellsize | |
|---|---|---|---|
| sim | 0.2 | 0.2 | 2 |
| sim | 0.4 | 0.4 | 2 |
| sim | 0.6 | 0.6 | 2 |
| sim | 0.4 | 0.4 | 4 |
For 3 different realisations in each parameter-sets the stress-strain curves are plotted.
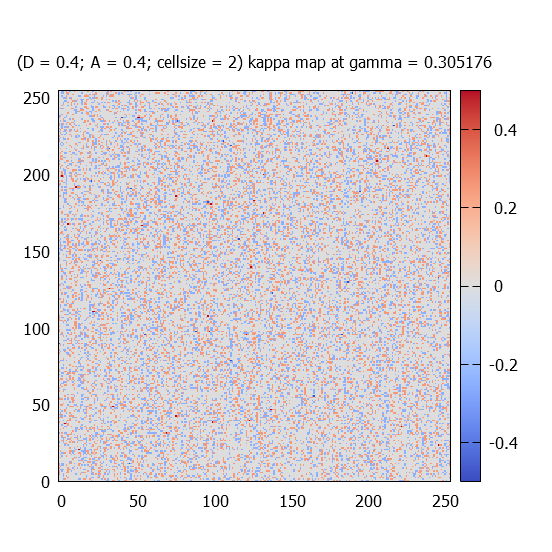
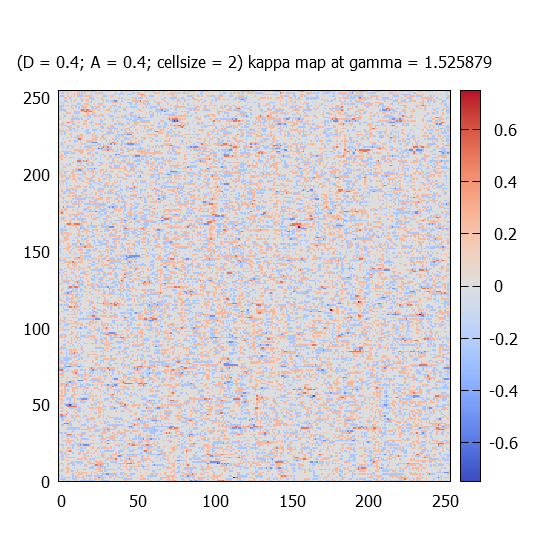
Quantities at different gamma values are plotted. These gamma values are preselected and can be modified at any time: 0.3, 1.5, 4.6, 15 (and sometimes 31).
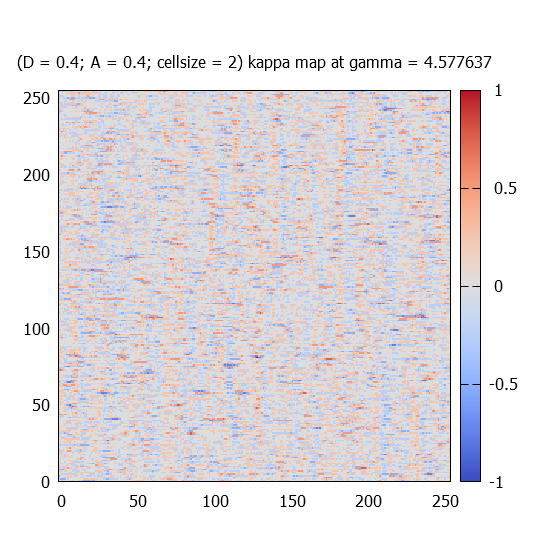
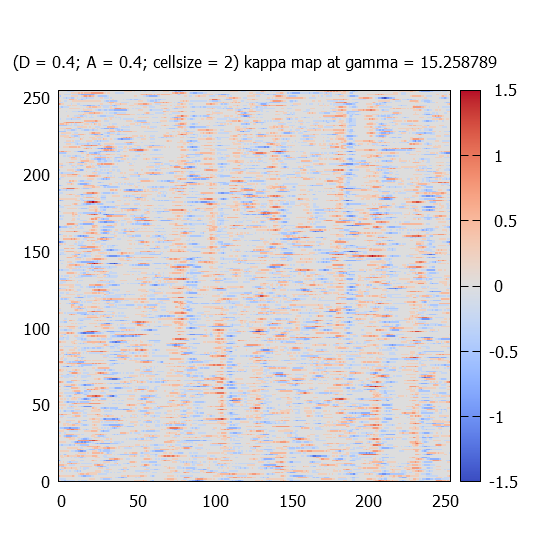
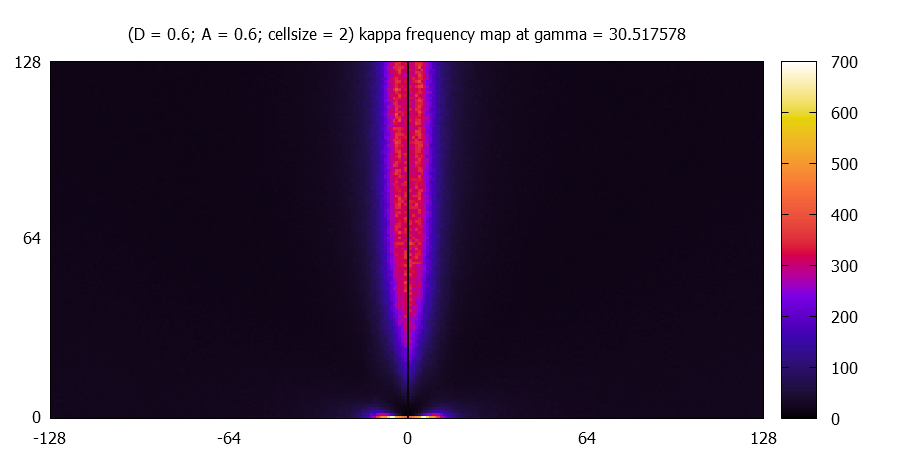
At different gamma values, kappa(r) fields (called maps) for one realisation are plotted for each paramter-sets.


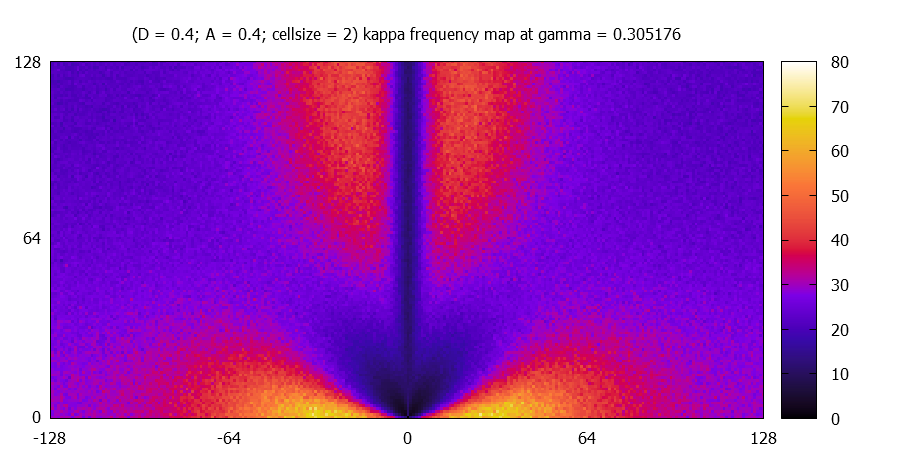
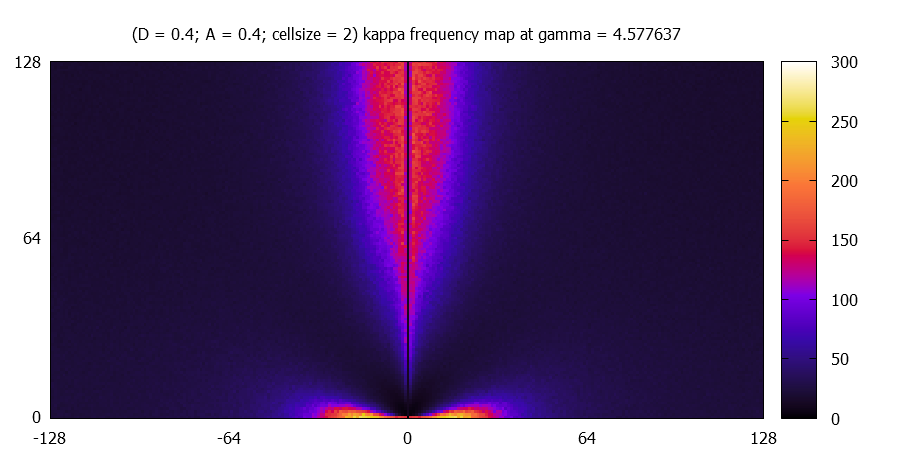
Each kappa map is fourier transformed, and the absolute value of the complex amplitudes (k_x,k_y) are averaged over 100 simulations. Due to the fact that the kappa maps represent real numbers, the |A| has the following symmetry: |A(k_x,k_y)| = |A(-k_x,-k_y)|. Therefore only one (the upper) half of the amplitude maps are calculated. Statistically a left-right symmtery should be found.


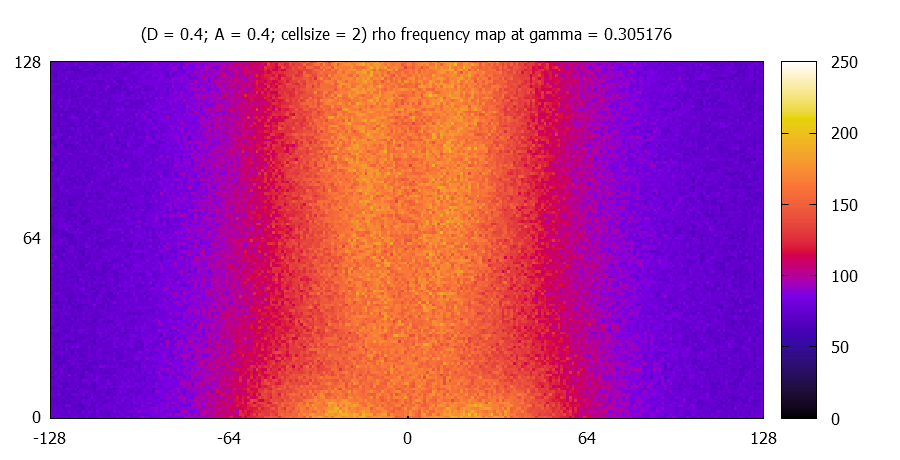
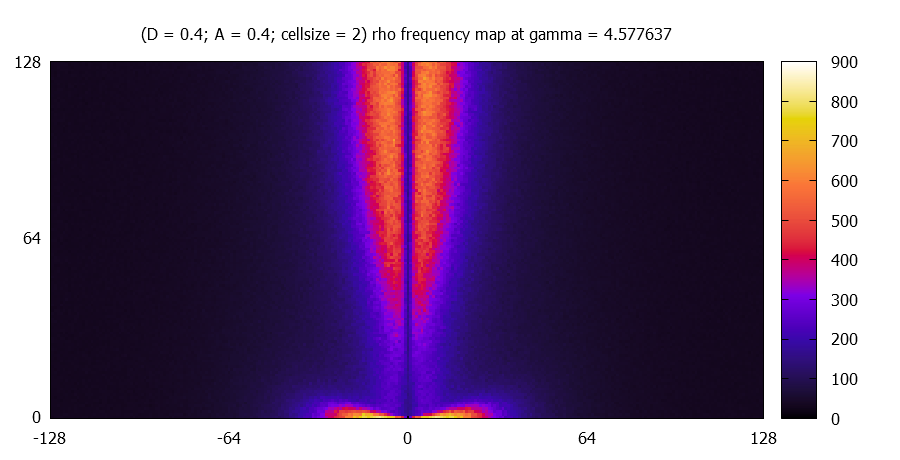
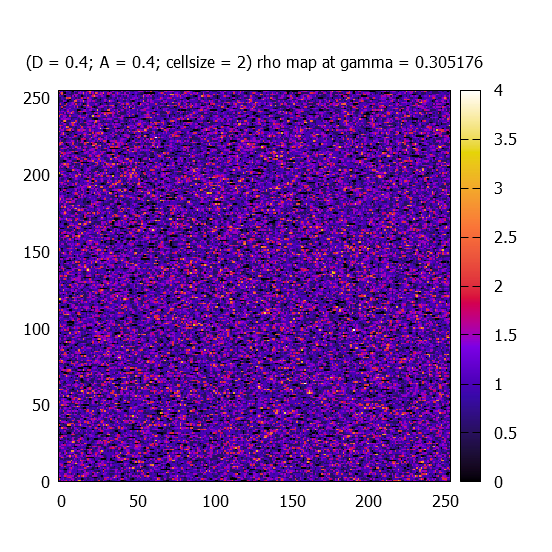
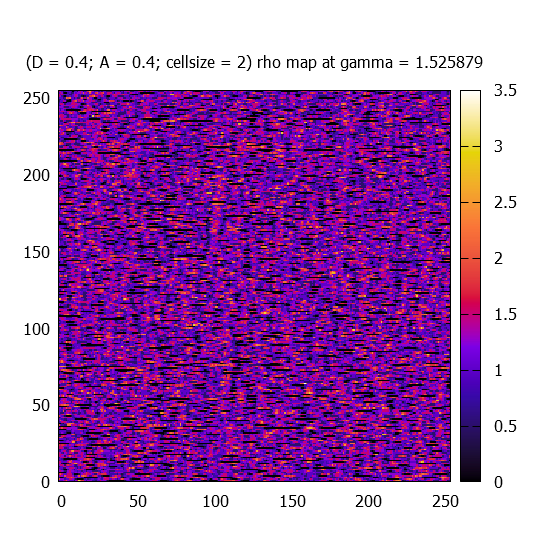
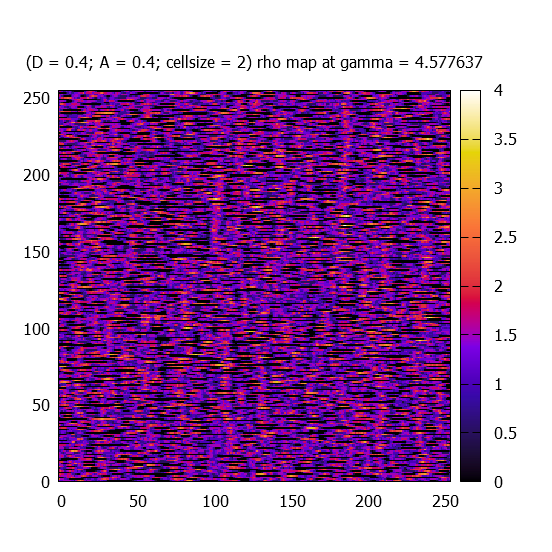
At different gamma values, rho(r) fields (called maps) for one realisation are plotted for each paramter-sets.


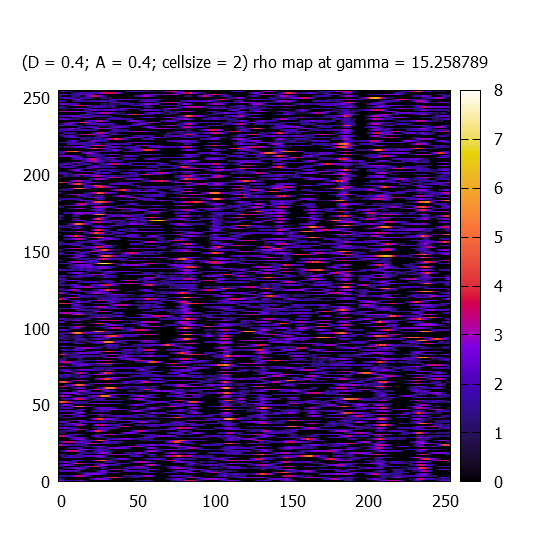


Each rho - rho_average map is fourier transformed (the average has to be substracted in order to avoid the extrem peak at (0,0)), and the absolute value of the complex amplitudes (k_x,k_y) are averaged over 100 simulations. Due to the fact that the kappa maps represent real numbers, the |A| has the following symmetry: |A(k_x,k_y)| = |A(-k_x,-k_y)|. Therefore only one (the upper) half of the amplitude maps are calculated. Statistically a left-right symmtery should be found.